Data does not speak for itself, it must be interpreted. As much as we want to convince ourselves that numbers on a page are black and white, in reality, there is always context in regard to what we are trying to find out, what we’re hoping to discover and what method we used to get this data.
In the realm of scientific research, p-hacking is a well-known term, especially after a paper titled, ‘p-Hacking and False Discovery in A/B Testing’ was published earlier this year to an overwhelming response on social media. p-Hacking (also known as data dredging) is when a data scientist is analyzing a set of results or following the progress of an A/B test and finds a pattern that could be stated as statistically significant, yet in reality, there is no real underlying effect.
In other words, a conclusion is taken from a set of results that have not been fairly investigated to deem the conclusion as fact. For example, flipping a coin 5 times and having it land on tails 3 out of those 5 times does not mean the chance of getting tails when flipping a coin is 60%. Results must be investigated deeper and analysed using it’s p-value to measure probability of anomalous results.
What is a p-value?
To understand p-hacking, the first thing to know is that this is referencing a p-value. This is the probability that the null hypothesis that you make before a study is true or not. This p-value is compared to your proposed ‘Significance Level’ at the end of the study to see whether your results may be deemed as statistically significant or not. Basically, if your eventual p-value is under your proposed significance level, you are not able to reject your null hypothesis and must investigate deeper.
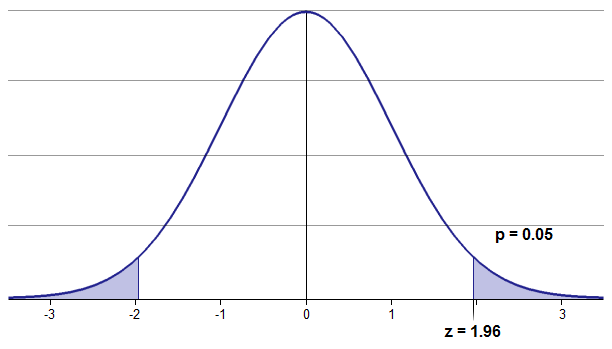
You can choose your significance value as anything you’d like, however it is important to note that most research papers use a value of 0.05 as the highest possible in order to reject your null hypothesis. Any results over this number must be further investigated.
For example, let’s say you are looking to find out how many of your viewers share content they have watched on social media. Let’s say of your 100,000 viewers this month, 5,000 of them shared a video on social media. Now if you wanted to look specifically at how many of these were men and women, you’d need to take into consideration your p-value before looking into any results.
How is it calculated?
To find the p-value of your study, you will need to first set a hypothesis containing the results you are expecting. We can then use this to calculate how to find your studies p-value.
1. Expected results
Following the example from earlier, let’s say that you’re expecting your results to be exactly 50/50 every single time, so 2,500 of the social media shares to be from men, and 2,500 of them to be from women. These are your expected results.
2. Observed results
Upon investigation of your data using a data analytics platform like YOUBORA Analytics, you find out that 2,400 of the social media shares are from men and 2,600 are from women. This conclusion points to the idea that women are 50% more likely to share video content on social media than men. But before you publish these findings, let’s find your p-value.
3. Degrees of freedom
Now that we have your expected results and your observed results, the last number you’ll need is your ‘Degrees of Freedom’. This is easily calculated with a simple equation.
N-1 (n=number of variables)
In this example, your degrees of freedom would be 2-1=1 because we had two variables, men and women.
4. Chi Squared
Compare your expected results to your observed results using the chi square. Known as x squared, the Chi square measures the difference between your expected and observed values. The equation for Chi square is x2 = Σ((o-e)2/e), where “o” is the observed value and “e” is the expected value.
Don’t forget that this equation includes a Σ (sigma). This means you’ll need to calculate ((o-e)2/e) for both men and women, then add the results to get your chi square value. In our example, we have two outcomes – either the social media share was from a man or a woman. Thus, we would calculate ((o-e)2/e) twice – once for men and once for women.
Let’s use our expected and observed values with the equation x2 = Σ((o-e)2/e). Keep in mind that, because of the sigma, we’ll need to perform ((o-e)2/e) twice – once for men and once for women. Our work would go as follows:
- x2 = ((2400-2500)2/2500 + (2600-2500)2/2500)
- x2 = ((-100)2/2500) + (100)2/2500)
- x2 = (10000/2500) + (10000/2500) = 4+ 4= 8
5. Find your chi square on the distribution table
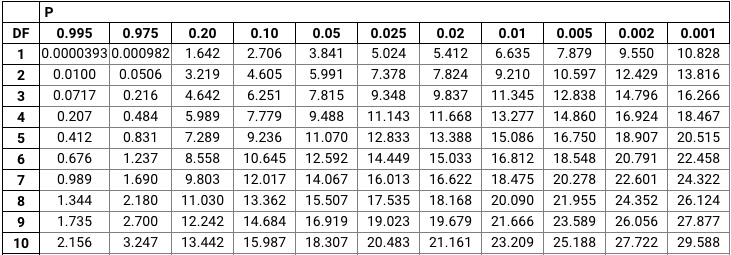
Once you have your chi square number it’s just a matter of finding your closest p-value on the chi square distribution table below.
The DF column is our Degrees of Freedom from earlier. So in our case, this value was 1. We then look across the table until we can find the closest number to our chi square value (8), which is 7.879 and corresponds to a p-value of 0.005.
As we stated at the top of this article, most research papers use 0.05 as the maximum level of significance so we will do the same in this case. This means that we can accept our results and reject our null hypothesis that men and women share their content on social media equally every single time.
This is obviously a deep and complicated issue, however, when you have this in mind while looking at data it is going to put you far ahead of competitors and give much more weight to your findings. 57% of marketers are guilty of p-hacking and ignoring this process or putting the significance level too high.
How far can we go with p-hacking?
The reality is that p-hacking is so important not just in analyzing your own data, but in understanding reports, studies and new statistics from other sources. Many studies are guilty of p-hacking, this is why you’ll constantly see two reports of the same thing that contradict each other. For example, one report may claim that drinking a cup of coffee every day will make you live 10 years longer, while another is sure that drinking a cup of coffee every day raises your chance of heart disease by 50%. These contrasting conclusions are part of the process of understanding data, but to know which is trustworthy and which isn’t, use the p-value.
To keep up to date on which reports are retracted every day we highly recommend checking out Retraction Watch.
To gain access to the data you need to grow your business, we have been building YOUBORA Suite, an industry-leading business intelligence platform that allows you to track user behavior, monitor platform performance and dig deep into your data to understand consumption patterns.


