
To assess how Spain’s foremost cycling event, La Vuelta 2023, performed in terms of streaming adoption, we examined NPAW customer data to reveal peak watching days, device share, and how the viewership for this year’s edition compared to the previous year.
NPAW’s data reveals a daily average playtime by unique viewer of 28.7 minutes for La Vuelta 2023. This statistic means that users engaged in watching about half an hour of the cycling event daily.
The diverse stages of La Vuelta 2023 saw varying degrees of engagement. With no fixed trend, some stages drew in considerably more views than others. Curiously, the peaks in plays occurred on September 9th and 10th. In terms of playtime, September 1st experienced the most viewership, followed closely by September 8th. However, the final stage saw the second-lowest total playtime, suggesting a decline in anticipation towards the end of the event.
Big-screen devices, such as set-top boxes (STBs) and TVs, dominated the streaming scene with 84.4% of total playtime share, suggesting that the majority of viewers watched the tournament in a traditional manner. However, some viewers, perhaps unable to access a big screen, turned to their smartphones, which accounted for a 9.3% playtime share. Other devices had an almost marginal share.
The peak viewing days for La Vuelta 2023 saw a significant increase in viewership KPIs, with the number of plays and unique users experiencing more than a 50% jump in contrast to other days. The most protracted stage, September 1st, unsurprisingly saw the highest playtime, which registered double the average of other days. Similarly, the average playtime drastically increased on peak days, jumping to 2.5 times higher than the average.
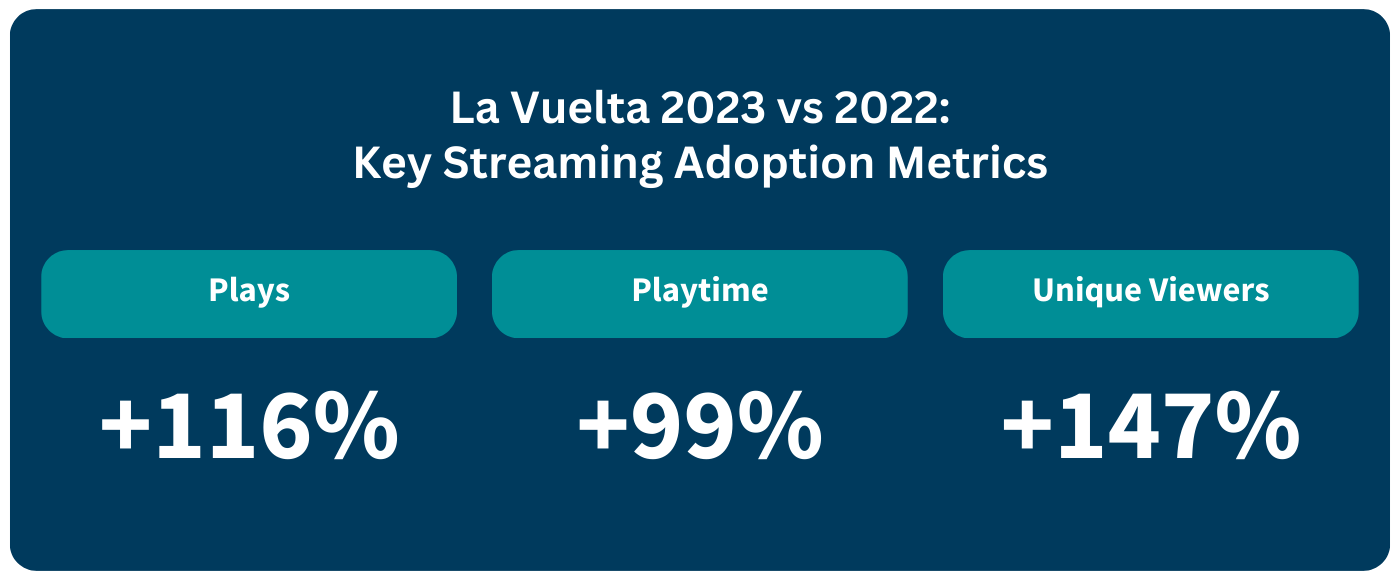
While looking at the evolution of streaming adoption year-over-year, we noticed a remarkable improvement in La Vuelta 2023 compared to 2022. Total playtime and plays saw a two-fold increase, and the number of unique users has surged exponentially by 2.5 times versus the previous year. However, the data also indicates small declines in the average daily playtime and average playtime by unique user, which means that users were slightly less engaged.