
This is an excerpt from NPAW’s Video Streaming Industry Report H1 2023. Download the full report for a detailed look at this and other trends shaping streaming strategies around the globe.
Big screens have been capturing the most streamed minutes for a while now — especially since technological advancements and the Covid-19 boom in sales pushed smart TV adoption to new heights. In the initial semester of 2023, big-screen devices, particularly TVs, continued to expand their dominance in VoD and notably in linear TV. On the other hand, small-screen devices lost share, particularly smartphones, consolidating their position as secondary streaming devices.
Smart TVs keep growing in popularity among VoD consumers
In the first half of 2023, smart TVs accounted for 51% of the total VoD playtime. Together with consoles and set-top boxes (STBs), this figure means that big screens captured 61% of all minutes streamed. This showcases the viewers’ preference for the traditional, full-format experience when consuming VoD content.
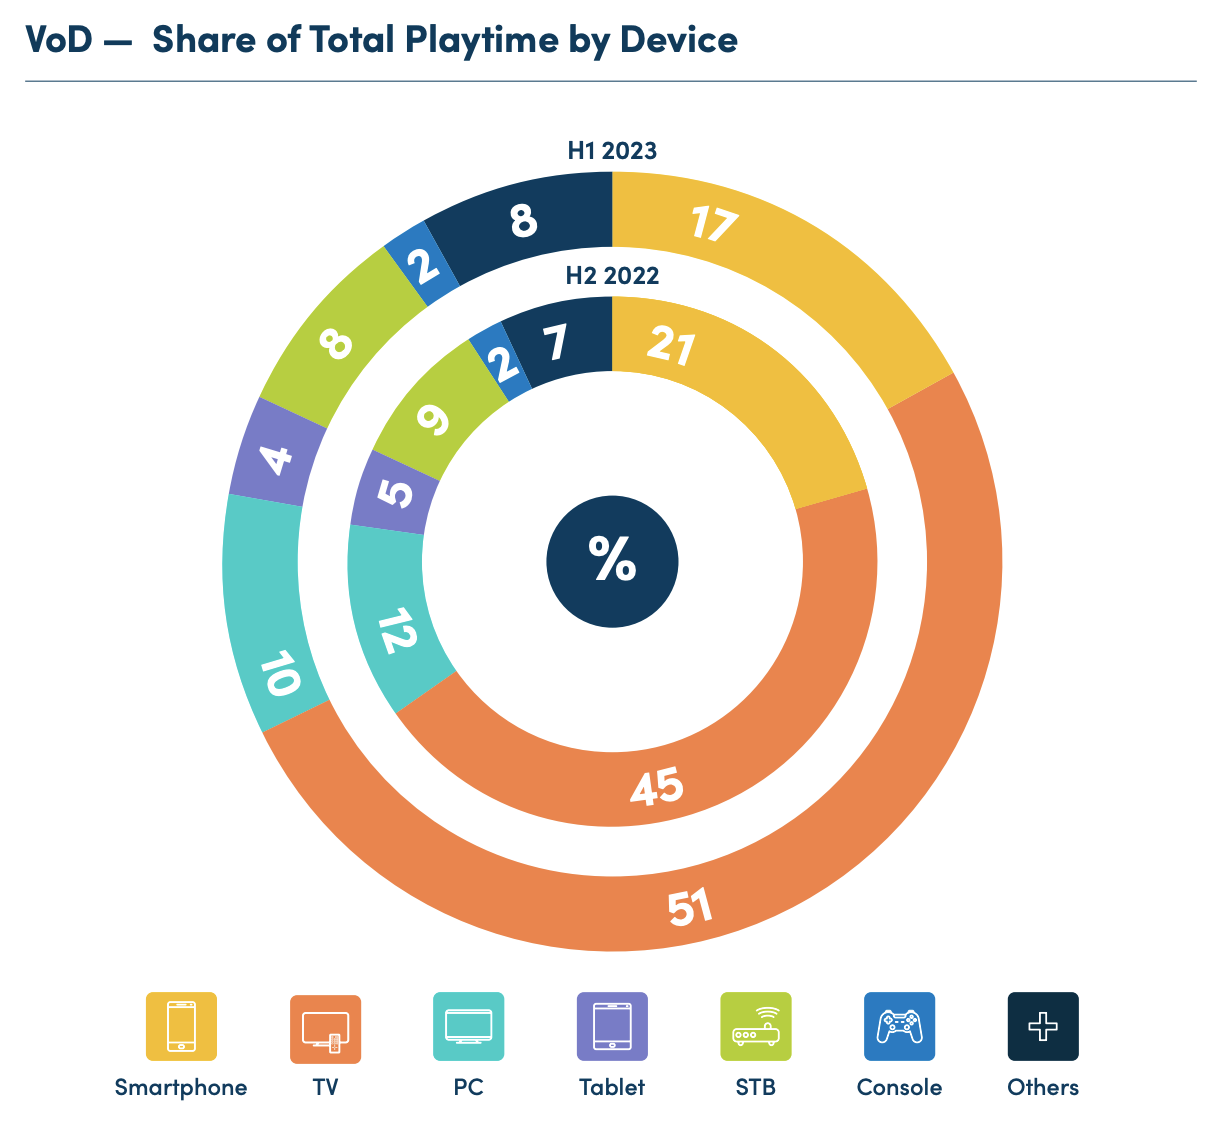
Moreover, smart TVs are increasing in popularity at the expense of small-screen devices. In H1 2023, smart TVs saw their relative playtime share increase by 6% compared to the second half of 2022 – which is precisely the combined percentage decrease for smartphones (-4%) and PCs (-2%). While they still hold the second and third positions respectively, smartphones and PCs are increasingly being used as secondary streaming devices for watching content on the move or when the household’s TV is unavailable.
Big screens also outpace smaller ones in terms of the average amount of time that each user spends streaming VoD content on each device. STB and console users streamed upwards of 120 minutes per day in H1 2023, followed at some distance by smart TV users with 95 daily minutes. Of the small-screen devices, smartphones registered the fewest minutes per day per user — over 20 minutes less than both tablets and PCs.
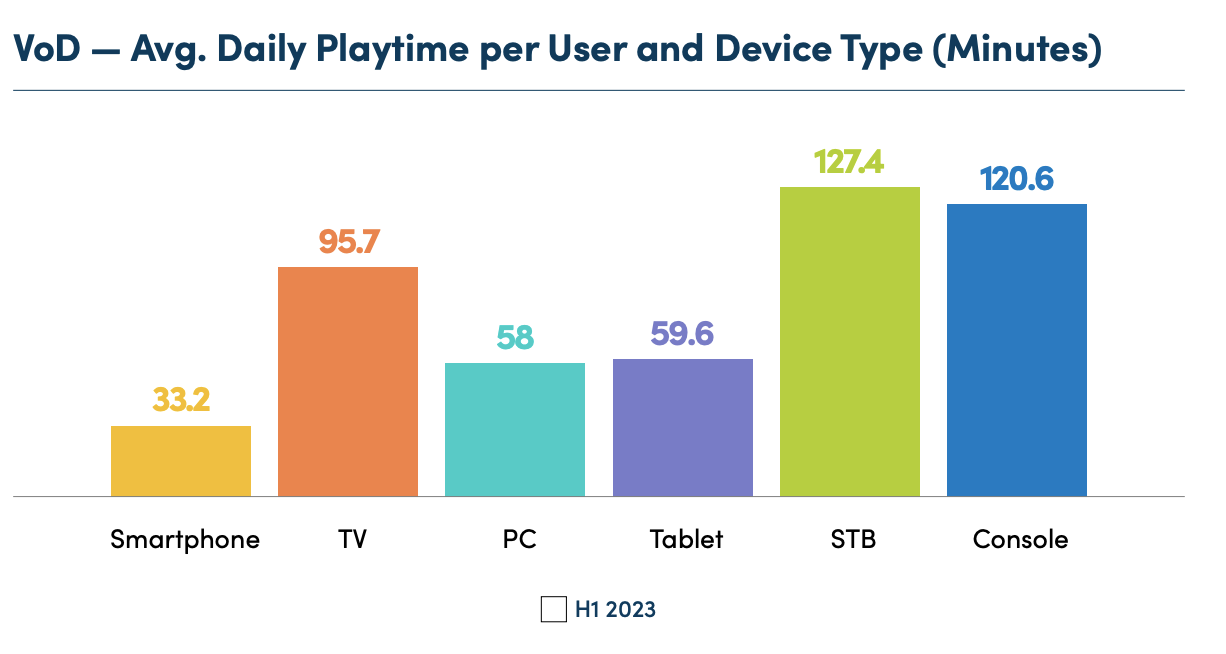
All devices saw an increase in the average daily playtime per user in H1 2023 vs H2 2022, particularly consoles with a 38% hike. Smartphones experienced the second largest increase, but this change was less noticeable given their already low overall use.
Online linear TV is even more about big screens than VoD
The majority of the total Linear TV playtime in H1 2023 was, once again, taken up by big screens — even to a greater extent than in VoD. Together, TVs and STBs accounted for 80% of the linear playtime, each holding an equal share of 40%. Consoles, with an insignificant share of 0.1%, were clearly not the device of choice for this type of content. Smaller screens (smartphones, PCs, and tablets) represented only 15% of the total playtime.
More so than with VoD, the gap between big and small screens underlines the consumers’ overwhelming preference for viewing linear content on larger, in-home devices, reserving smaller screens for the occasional streaming of sports competitions and live shows when on the move or when TVs are occupied.
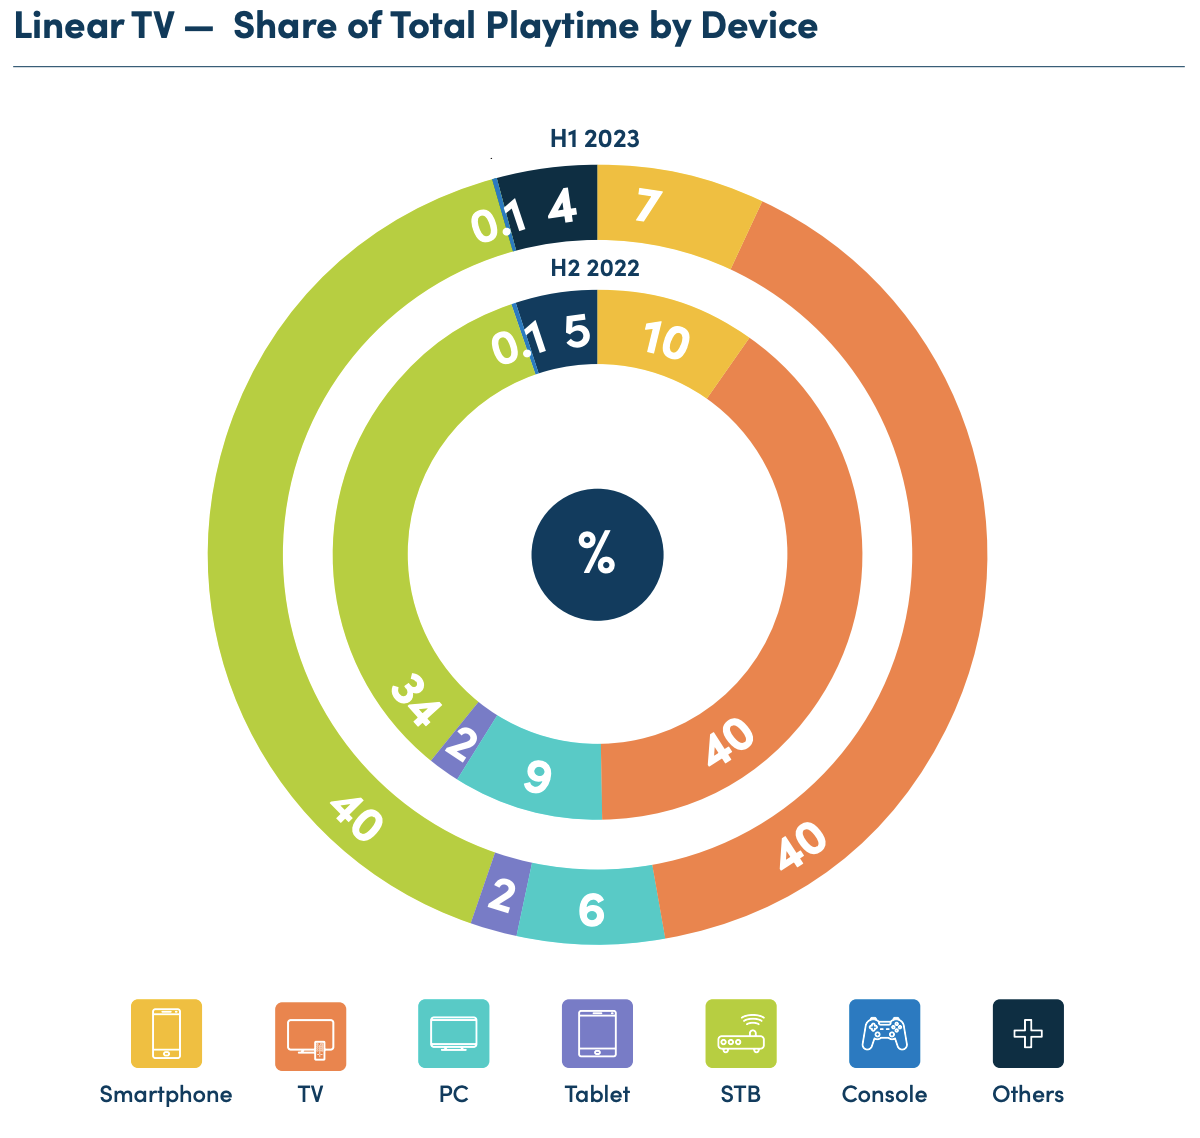
STBs were the only devices to experience an increase in the share of playtime in H1 2023 vs H2 2022, with a 6% gain. This increase was largely at the cost of smartphone and PC usage, each seeing a 3% decline, as well as the 1% decrease in tablet usage. The gap between small and big-screen formats is thus widening — a development worth tracking into the second half of the year.
Regarding the average duration users spend on each device type watching linear content, larger screens also exhibit the highest engagement. STBs recorded the most playtime per user per day in H1 2023 with 91 minutes, followed at a distance by consoles and TVs. When looking at smaller-screen devices, a significant gap emerges in daily user engagement between PCs and tablets (50 and 42 minutes respectively) and smartphones (20 minutes). This indicates that smartphones are often used for shorter streaming sessions while outside of the household or when a TV is unavailable.
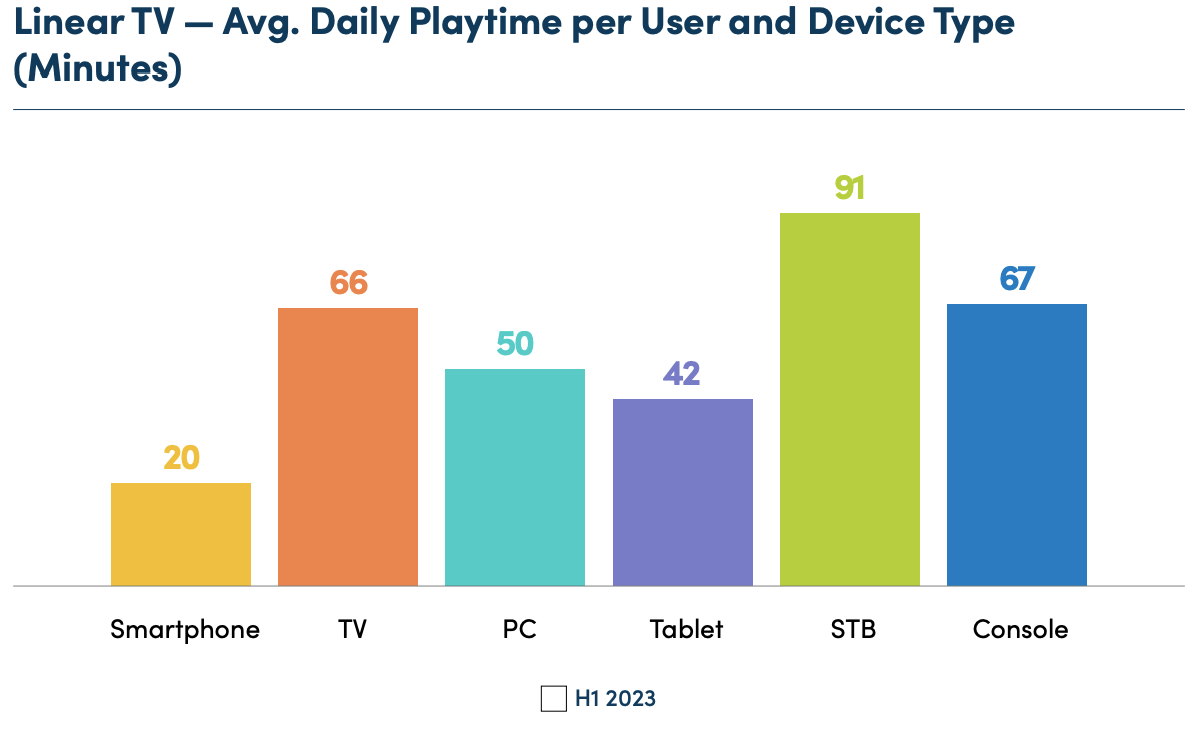
Interestingly, despite being the devices with the highest playtime per user, STBs were the only ones to witness a decline in the metric compared to the second half of 2022 (-18%). Consoles saw the most significant rise (+35%), followed by tablets (+22%) and smartphones (+19%).
—
Want to learn more? Get your copy of NPAW’s Video Streaming Industry Report H1 2023.