
For video businesses looking to grow in a dynamic and unpredictable landscape, return on investment is key. Whether you’re an SVOD, AVOD or TVOD, top-tier user experience sustains success.
When you’re consuming video content, there’s nothing that will make you click away sooner than bad video quality. This means long loading times, constant buffering, rendition changes and general errors that interrupt playback. As competing video services look to improve their service, user tolerance to poor quality of experience (QoE) becomes shorter.
Whereas in the past just having access to exclusive content was more than enough reason to endure frustrating playback issues, in the current climate, with the number of third-party providers sharing their content among a number of distributors, the QoE has become crucial in helping users decide not only which service they should subscribe to, but whether they should continue with that service.
Understanding your own video platform’s QoE can be difficult without the use of an analytics solution like YOUBORA Suite which can offer full visibility of the most important metrics in real-time to help companies locate areas for improvement and configure their service to perform at its best. Speaking to customers is crucial in order to understand how your service can improve but when you’re working with millions of views a week, monitoring the entire platform performance filtered by country, CDN or Device can offer incomparable insights.
QoE is made up of many KPIs which video services need to track in order to gain clarity of their platform performance. These quality metrics can also be broken down into more specific areas of concerns such as buffering and playback errors. In this post, we’re going to look into exactly how much poor streaming QoE impacts video revenue.
The Impact of Quality Metrics
Before we go into buffering and errors in detail, let’s first take a look at how general quality metrics affect user behavior.
Content delivery issues account for nearly 70% of viewers’ frustrations with online video. And of these frustrations, a third of users claim that interruptions (re-buffering) are the most irritating aspect of video consumption.

In 2017, our partners over at akamai technologies released a whitepaper which looked into the effect that poor QoE has on the user’s emotional state. Using facial coding, they found a 16% increase in negative emotions when dealing with rendering issues and rebuffering amongst other interruptions.
But poor video quality isn’t just about one poor session resulting in a user exit. Leaving a bad taste in users mouths tests the tolerance of users who are more likely to shop around in the search for a reliable stream.
If you’re an SVOD, you have time to recover from this depending on your chosen renewal period, however, for AVODs and TVODs, users are much more likely to churn as they have no obligation to return to your service.
Offering a hybrid business model can resolve this issue. For AVODs looking to create returning users, offer a premium subscription to go ad-free. For TVODs, offering discounts to different content based on what they have seen will entice them to stay (more than 50% of users return for the price).
The truth is that combating churn is a high return investment—A 5% boost in customer retention rates correlates with an average 25% increase in profits. For SVODs, it is seven times cheaper to retain a customer than acquire one.
The Impact of Buffering
25% of viewers claim that startup buffering is the most irritating aspect of internet video consumption. This isn’t as much as mid-stream interruptions (30%) but tells us about the dwindling tolerance of viewers and demand for immediacy when it comes to on-demand content.
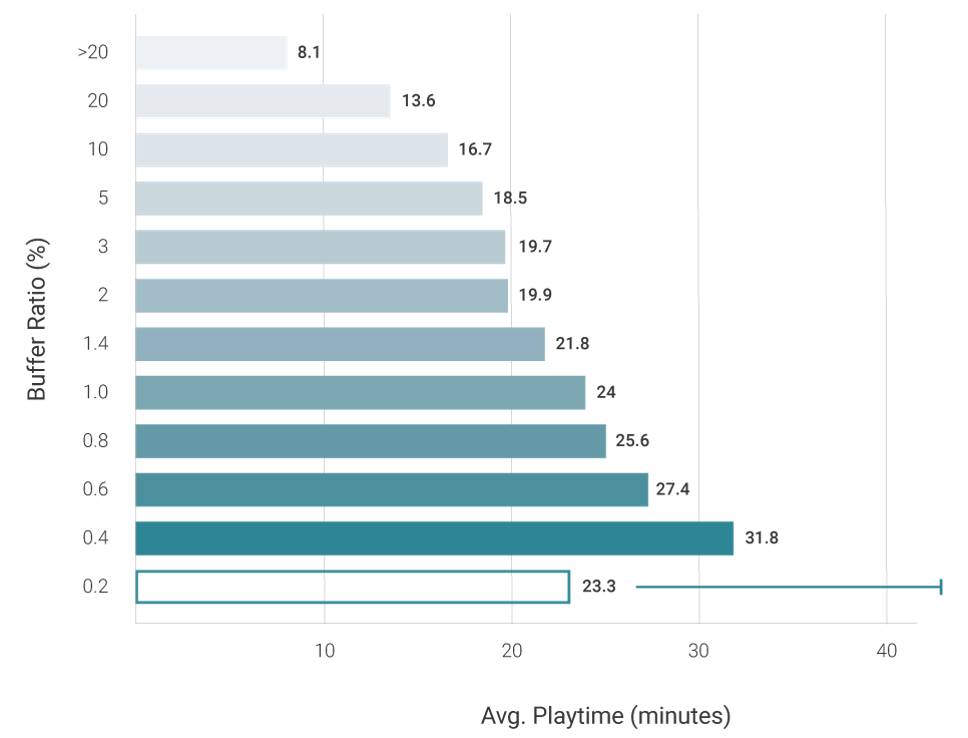
As seen in the graph above, the higher the general buffering is within a session, the shorter that session will end up being. In our whitepaper, “The Pillars Of Video Performance: Buffer Ratio”, we found that once the percentage of total playback that is spent watching the buffer wheel goes above 0.4%, view time will drop by at least 30%.
This has a direct impact on the stickiness of your service and can increase the likelihood of churn. A user who experiences just one buffering event is 2.32% less likely to revisit the same site within a week than a similar viewer who experiences no failure.
For example, when we see users experience a buffer ratio of 2% of their total playtime, we see churn increasing in likelihood by 30%.
The Impact of Errors
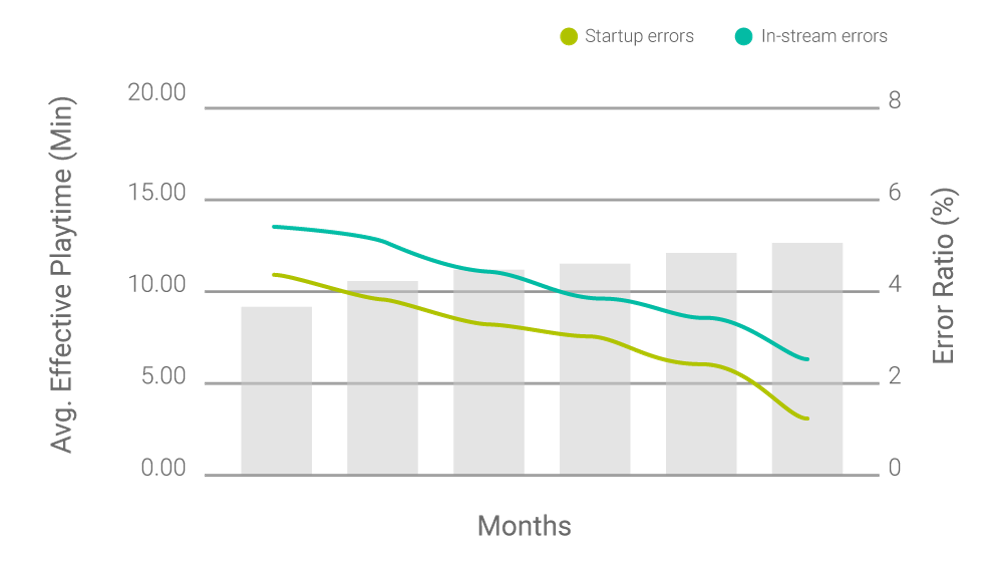
The average effective playtime (meaning time spent consuming content and not waiting for content to load) of VOD content rises as the error percentage goes down. Average effective playtime was 38% higher at 2.5% error frequency than at 5% error frequency.
When play errors go above 2% of total views on your platform, the churn rate of new users can reach a deadly 50% so if you’re looking to impress first-time viewers, QoE needs to be considered a top priority.
To be frank, creating a reliable streaming service is no easy feat. It requires the optimum configuration of all servers, CDNs and players in all geographic locations through all ISPs as well as many other variables. The best way to get a birds-eye view of your entire platform and dive deep into any anomaly you discover is with an analytics tool like YOUBORA Suite.
How are video services tackling this issue?
Vonetize
Vonetize used YOUBORA to identify optimal CDN strategies in international markets. They found an inconsistent QoE depending on the country. In Brazil, problems were caused by ISP internet congestion times and the variability of bandwidth available depending on the partner. YOUBORA’s CDN balancer tool allowed them to prioritize between partners, the one that would give the user the best quality of experience.
Additionally, Vonetize realized that customer support was reaching unacceptable levels of 3rd level engineering support due to the lack of detailed information of what was happening at the user level. Implementing YOUBORA Analytics allowed them to reduce the number of tickets passed on to the 2nd and 3rd level of support inside the company.
Fox+ Asia
Fox+ monitored their quality metrics with YOUBORA and were able to make smarter business and technical decisions that allowed them to save money.
“One of the key things we found is that the average bitrate varies significantly among different countries – even among different ISPs within the same country. By analyzing this information, we decided not to carry all the data-heavy renditions of some content to certain markets and devices. This has enabled us to save a lot of money and time. Overall, it has helped improve the user experience.”
– Chang ha Kim, Business Intelligence Analyst
If you’re curious how you can take control of your data and gain full clarity of your platform performance to see where bad QoE comes from and where your attention needs to be in real-time, learn more about YOUBORA Suite here.