
Joining our list of pre-defined dashboards which have been designed with our customers’ needs in mind, the Errors Dashboard addresses customer concern regarding not only what types of errors are affecting playback, but how many users each error is affecting and whether this is leading to a play crash.
“Errors are one of the most important things a business can track,” says our Head of QA, Maria Lopez.” We have been building the Errors Dashboard recently and this is the perfect place for customers to see exactly how many errors are occurring, where in the playback they are happening and whether they lead to a view crash or not.”
Our product and development teams have been testing the new dashboard intensely over the past few months to guarantee that data is accurate and that value is created for customers. After giving it a test-run at the NAB show earlier this month, we’re ready to show off our latest pre-defined dashboard
What does it look like?
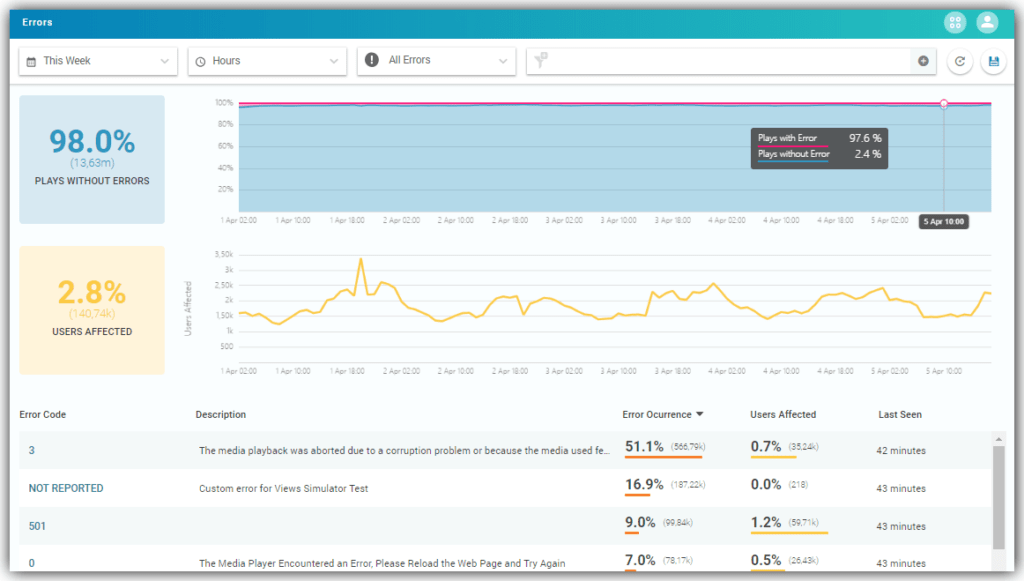
Built in the same image as our standard dashboards, the Errors Dashboard comes with four built-in widgets that visualize crucial KPIs for video services as well as an errors table which shows impact of each error on your platform, including how common an error is, the percentage of your total users affected and when this error last occurred.
The data in the dashboard can be viewed in any time frame from a number of hours to a number of years depending on your package allowance. Data can be viewed in a granularity of hours or days and can be filtered so that you see data from all errors, Startup Errors, Startup Errors that crash, In-stream Errors or In-stream Errors that crash. This way, you can break down your data to understand the frequency of each platform error.
As with all features in YOUBORA, this data can be filtered by any of our 30+ dimensions including Country, Device, Title, CDN and more so that you can understand where these errors are coming from and what impact they are having on your service.
For example, you may only want to see In-stream Errors that have come from Spain, Portugal and France over the past 24 hours. This can be done using the drop-down menus at the top of the page and then investigated deeper by scrolling along the line graphs and in the Error table.
Which KPIs are tracked?
The Errors Dashboard features two main KPIs: Plays Without Errors and Users Affected. These are both shown in percentage and numeric total.
Plays Without Errors – This KPI shows the percentage and number of views, regardless of which user they came from, that experienced at least one error.
Users Affected – This KPI focusses on the users themselves, showing the percentage and number of users who have experienced at least one error within your time frame selected.
These KPIs are also represented in the line graphs on the right-hand side. This will transform depending on the time frame and granularity selected.
Investigate individual errors
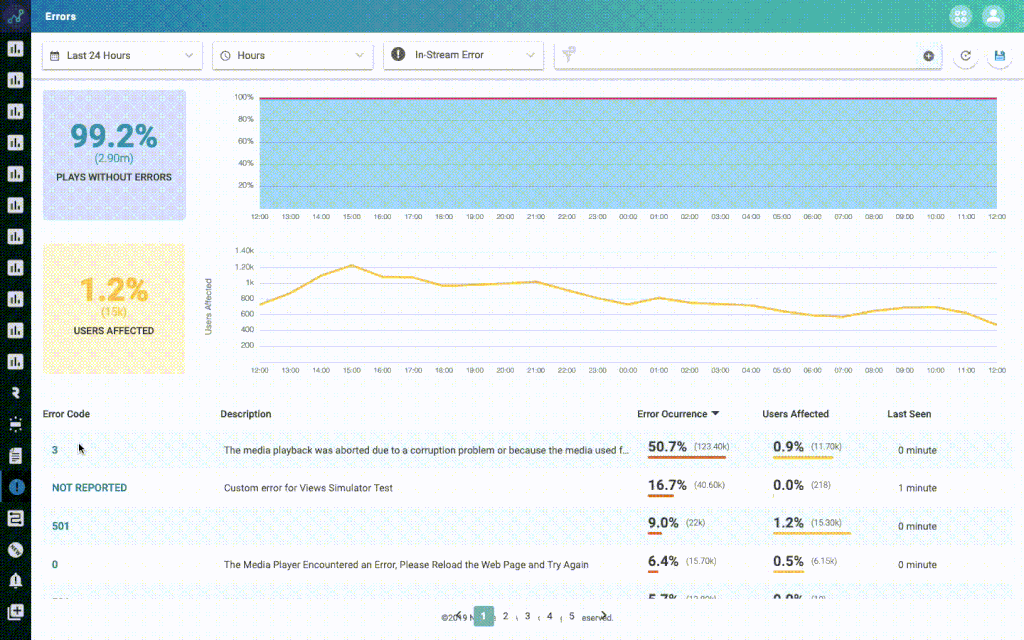
Additionally, all errors can be further investigated by clicking on their error code within the errors table.
This will bring up a side-panel which shows an evolution of the error frequency as well as an error total over the time frame selected within the Errors Dashboard.
This allows you to track each errors’ frequency over time and filtered by any dimension you choose. This way you can see which variables are having the greatest effect on your quality of experience (QoE) so you create a strong and reliable platform for your users.
For example, let’s say you see a spike in error frequency at 6PM. Using this feature, you can select dimensions to filter your data and then understand which variables are causing this spike. When filtering by Title you see that your newest release is creating a large proportion of your total platform errors. with this information, you can make data-informed decisions to fix issues with your content performance.
If you’re curious how you can take control of your data and gain full clarity of your platform errors to see where they’re coming from and what further issue they’re leading to, request a demo to learn more about our platform, YOUBORA Suite.