
We are proud to introduce Benchmarks, the latest addition to the NPAW Suite of products. With this new solution, you can now compare your performance against the industry average, at any time.
Knowing your KPIs and optimizing quality based on your historical values is good, but how do you know if you are delivering a better experience than competitors in your region?
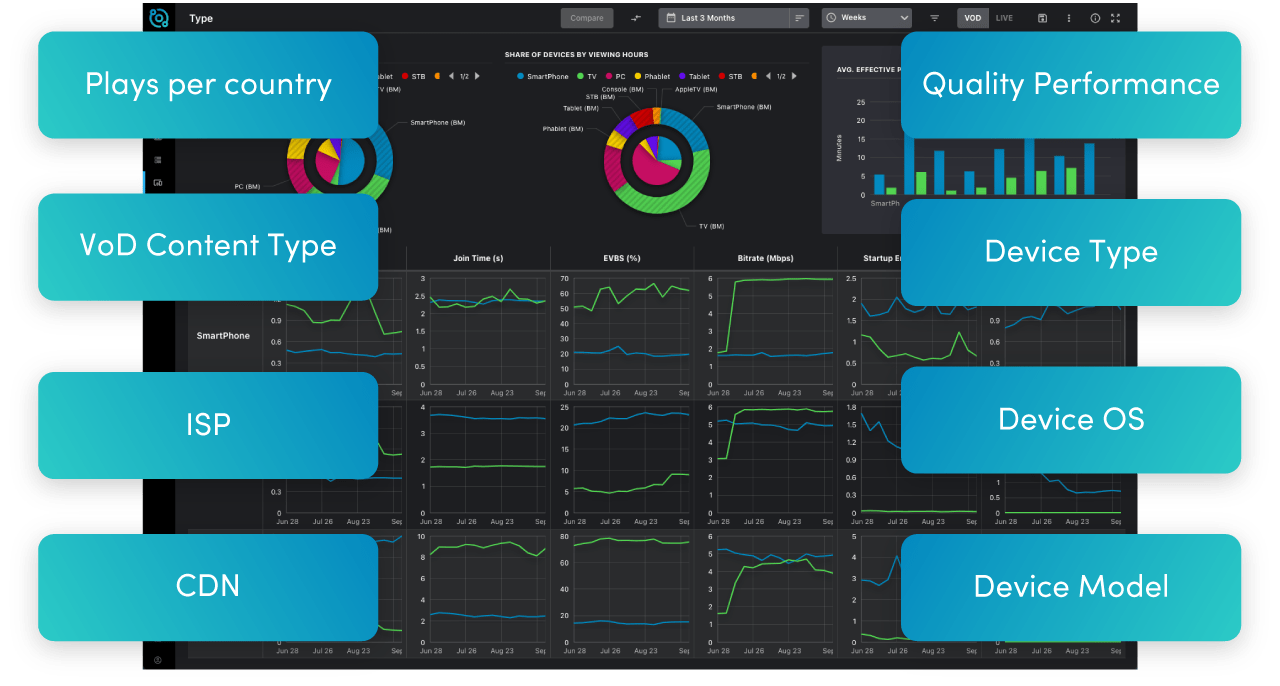
NPAW Benchmarks shows you exactly where you stand compared with industry averages through eight different pre-defined dashboards. All without having to wait for a hundred-page report to download.
The benefits, at a glance
NPAW Benchmarks will help you:
- Understand where you stand against the competition
- Pinpoint areas of poor performance by comparing your various KPIs
- Identify quality trends for a specific market to adapt your device strategy
- Evaluate and improve agreements with third-party providers, such as CDNs, to ensure premium QoE
For more details on the benefits of QoE Benchmarks, you can take a look at the product leaflet.
How does NPAW Benchmarks work?
- Use the Sample Overview dashboard to understand the market scope
- Filter the sample by selecting the time range and region you’d like to analyze
- Use the different dashboards to compare data from your main account with data from NPAW’s database, for example:
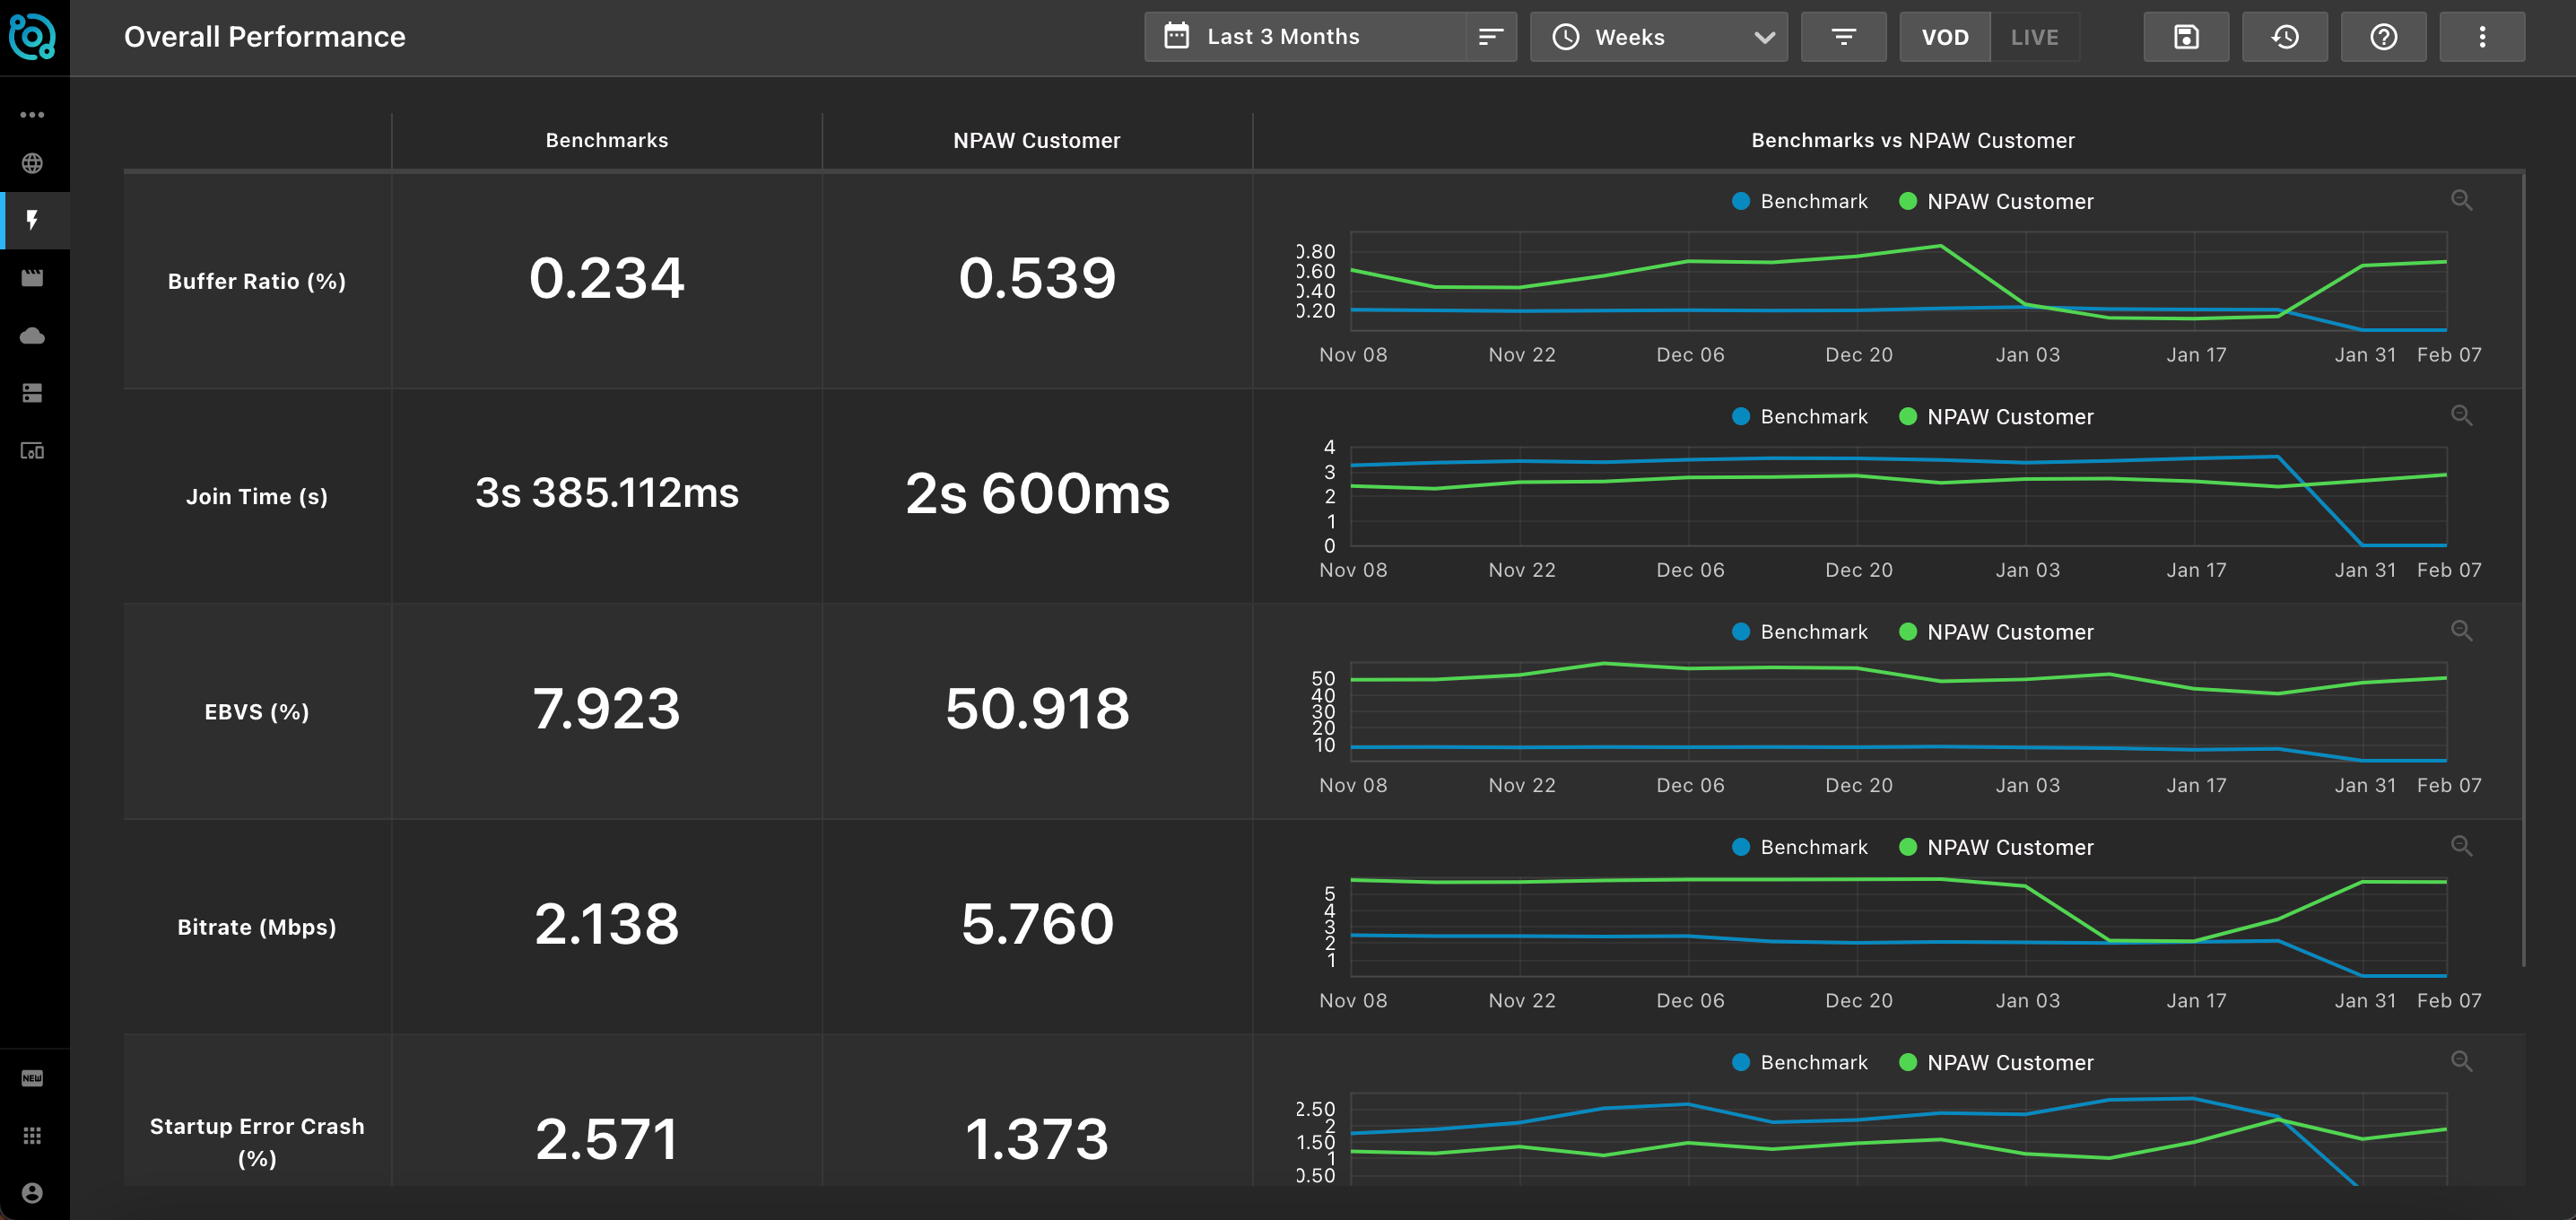
- Compare the 6 main quality metrics in numbers and line graphs
- Analyze completion rate divided by content duration categories (Short, Episode, and Movie)
- Compare the performance of the top ISPs across the main 6 quality metrics
- And many more
Benchmarks: applied
A typical daily challenge: Let’s say your company is looking to consolidate its presence in a country it just started to service. The first thing you need to do is evaluate the industry’s current situation in the country and compare your plays and quality against it.
Solution: Use NPAW Benchmarks to see how your plays and quality KPIs compare with this country’s market to measure product recognition and consumption.
Use the Overall Performance dashboard to see how your quality KPIs stand against the country’s average. This will allow you to pinpoint areas of weak performance on which to focus to meet your customers’ quality standards.
To evaluate the impact that your quality KPIs have on your content consumption for the region, go to the VOD Content dashboard and check how your average playtime for different content lengths compares with the industry average.
Use the ISP and CDN dashboards to see how well different providers perform in this specific country in terms of quality metrics. This will help you understand if you are working with the right providers and whether or not they are delivering top results for your service.
Also, check the different Device dashboards for detailed information regarding Device Type, OS, and Model for the region.
How can I get Benchmarks?
NPAW customers already have in place the integration needed to start using Benchmarks. Contact your sales representative or customer success manager for more details or a presentation.
If you are yet to jump into the NPAW Suite, request a demo to discover how QoE Benchmarks and our other solutions can help you boost your streaming experience.