
While pretty much all experts agree that the quality of experience holds the key to success in today’s hyper-competitive streaming industry, it can be hard to come by a data-based demonstration of exactly how video streaming quality affects user engagement.
That is exactly why, as part of our Video Streaming Report H1 2022, we looked at the main quality metrics shaping the viewing experience across regions and correlated them with consumption data from the last six quarters. The results, a snapshot of which is presented in this article, show how ensuring a superior experience can help services stay ahead of the competition and retain users.
What does quality of experience mean in video streaming?
First things first — what are we referring to when we talk about quality of experience? In video streaming, quality of experience (QoE) is a multi-dimensional concept encompassing everything that impacts the end user’s viewing experience.
QoE includes aspects like video quality and resolution, but also how long it takes for a video to initially load or if users encounter buffering throughout their playback. It also has into account the app that users are using to stream content on, and whether or not it is presenting issues that affect navigation and playback. You can learn more about the various QoE metrics in our white paper on how to measure video streaming quality.
The important point here is that a superior streaming experience goes beyond content. Regardless of how good a platform’s content is, users will engage less with it if their viewing and app experience is of poor quality. With plenty of other options to choose from, a dissatisfied customer can quickly be lost to the competition.
How streaming quality affects user engagement
So, for our latest Video Streaming Industry Report ,we worked on a series of graphs that illustrate how user behavior changes depending on QoE metrics.
The Avg. Buffer Ratio, for instance, is a major driver of user dissatisfaction and can severely impact the total time users spend on a streaming platform. By comparing Avg. Buffer Ratio with Avg. Daily Playtime per user and service for Linear TV, it can be clearly seen how the regions with lower amounts of buffering (North America, Europe, and the Pacific) also registered the highest daily consumption throughout the period. Conversely, as Avg. Buffer Ratio increased, the various regions saw progressively lower Avg. Daily Playtime figures.
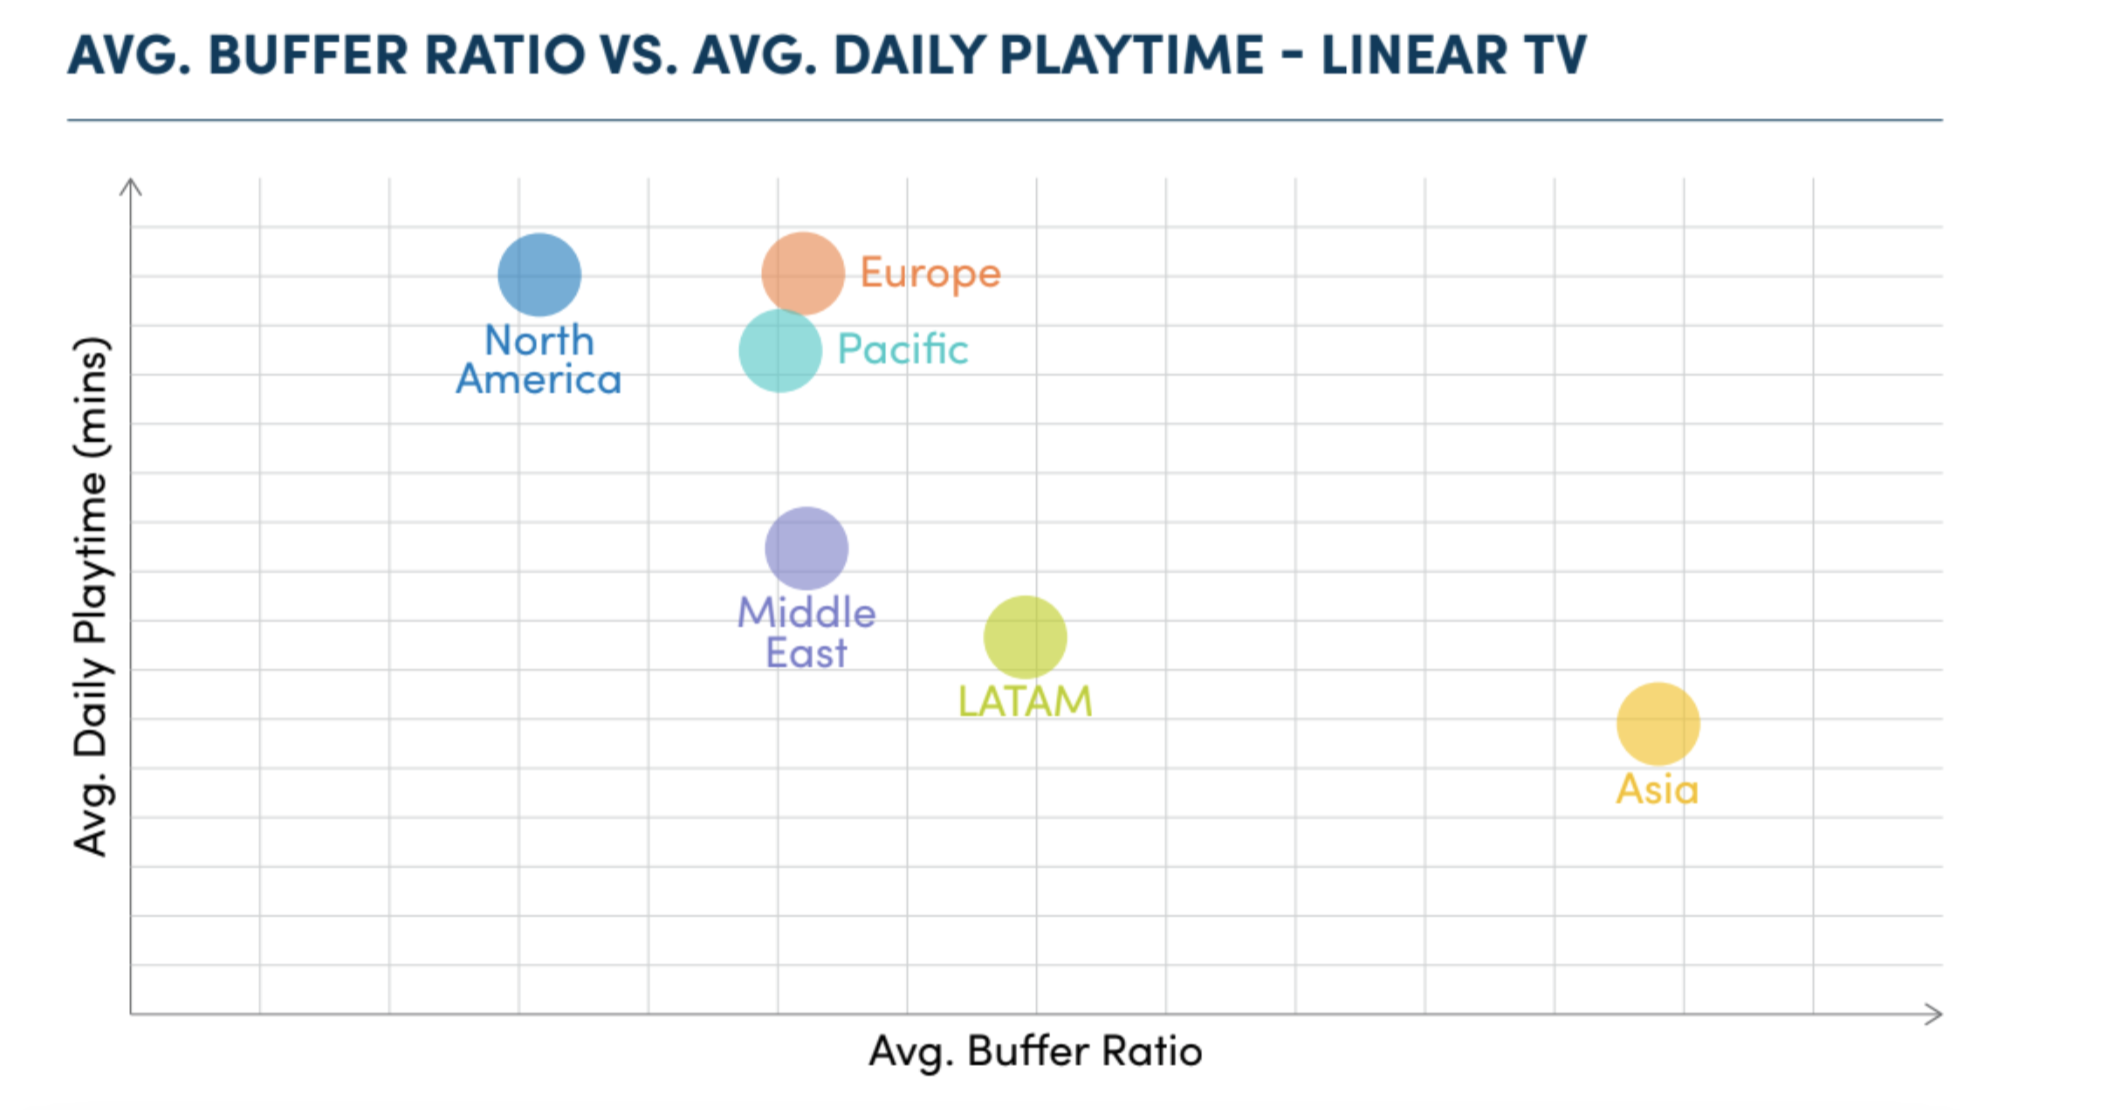
It is worth noting, however, that, while this principle holds true overall, regional preferences and consumption trends are also an important part of the equation. That is why, for example, the Middle East had a significantly lower Avg. Daily Playtime than Europe or the Pacific while having a similar Avg. Buffer Ratio.
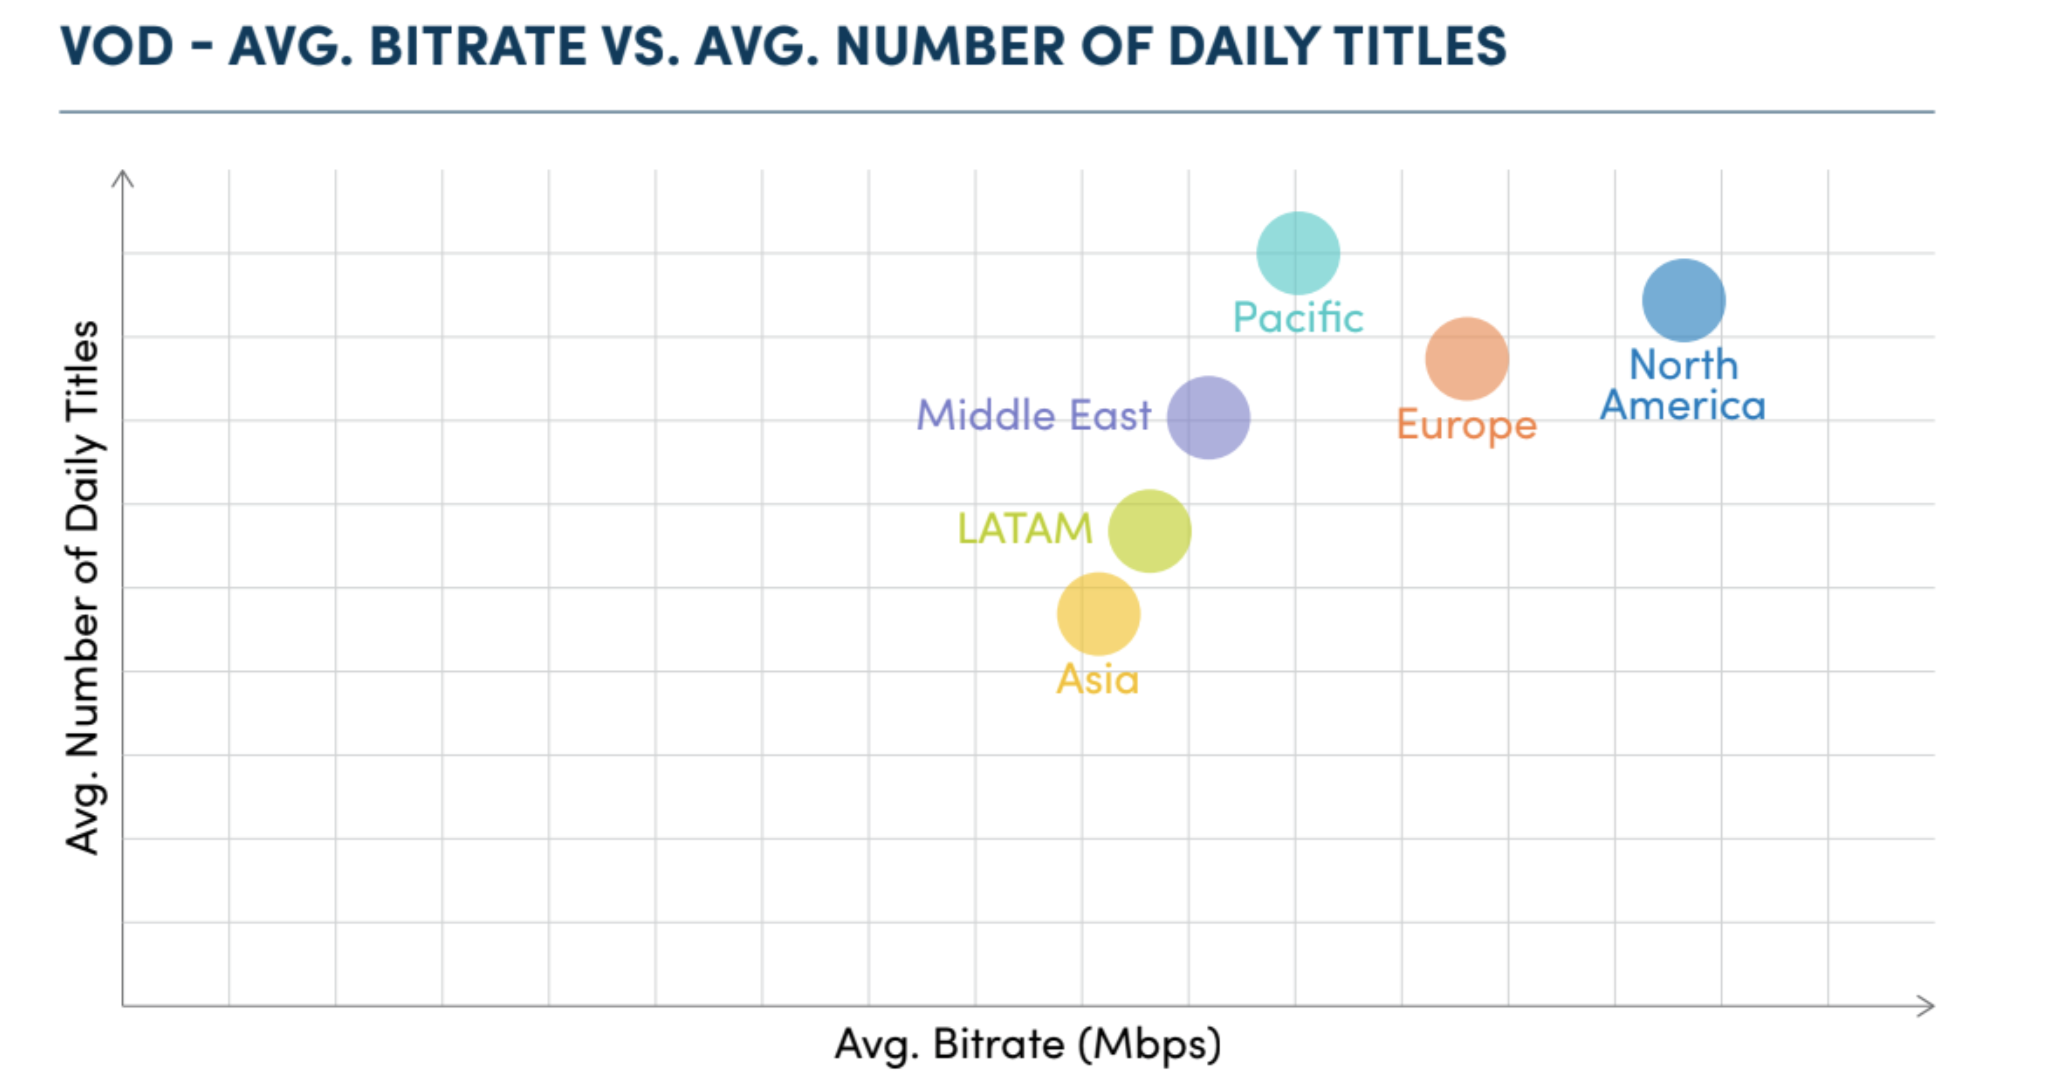
Another key metric for user engagement is the Avg. Bitrate – the higher the video quality, the higher the consumption. For instance, by comparing Avg. Bitrate levels for VoD with the Avg. Number of Daily Titles per user and service, it can be observed how higher quality levels result in users watching more episodes per day. Therefore, a VoD service looking to increase binge-like behavior would need to push for higher quality levels if it wants to succeed.
Interested in learning more? Download NPAW’s Video Streaming Industry Report H1 2022 for more details on how video streaming quality affects user engagement.